|
|
| |
|
|
| |
|
|
|
|
| |
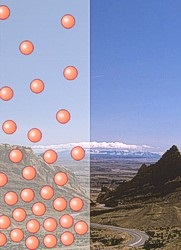 |
| The number of
molecules in the atmosphere decreases with
height. |
Air Pressure
The atoms and molecules that make up the various layers
in the atmosphere are constantly moving in random
directions. Despite their tiny size, when they strike a
surface they exert a force on that surface in what we
observe as pressure.
Each molecule is too small to feel and only exerts a
tiny bit of force. However, when we sum the total forces
from the large number of molecules that strike a surface
each moment, then the total observed pressure can be
considerable.
Air pressure can be increased (or decreased) one of two
ways. First, simply adding molecules to any particular
container will increase the pressure. A larger number of
molecules in any particular container will increase the
number of collisions with the container's boundary which
is observed as an increase in pressure.
A good example of this is adding (or subtracting) air in
an automobile tire. By adding air, the number of
molecules increase as well the total number of the
collisions with the tire's inner boundary. The increased
number of collisions forces the tire's pressure increase
to expand in size.
The second way of increasing (or decreasing) is by the
addition (or subtraction) of heat. Adding heat to any
particular container can transfer energy to air
molecules. The molecules therefore move with increased
velocity striking the container's boundary with greater
force and is observed as an increase in pressure. |
|
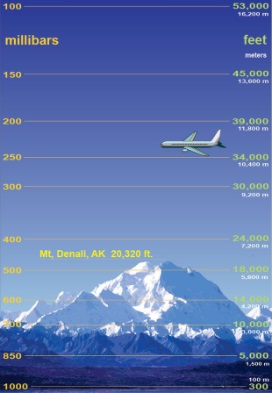 |
| The difference in
pressure as height increases. |
Since molecules move in all directions, they
can even exert air pressure upwards as they smash into
object from underneath. In the atmosphere, air pressure
can be exerted in all directions.
In the International Space Station, the density of the
air is maintained so that it is similar to the density
at the earth's surface. Therefore, the air pressure is
the same in the space station as the earth's surface
(14.7 pounds per square inch).
Back on Earth, as elevation increases, the number of
molecules decreases and the density of air therefore is
less, meaning a decrease in air pressure. In fact, while
the atmosphere extends more than 15 miles (24 km) up,
one half of the air molecules in the atmosphere are
contained within the first 18,000 feet (5.6 km).
Because of this decrease in pressure with height, it
makes it very hard to compare the air pressure at ground
level from one location to another, especially when the
elevations of each site differ. Therefore, to give
meaning to the pressure values observed at each station,
we convert the station air pressures reading to a value
with a common denominator.
The common denominator we use is the sea-level
elevation. At observation stations around the world the
air pressure reading, regardless of the observation
station elevation, is converted to a value that would be
observed if that instrument were located at sea level.
The two most common units in the United States to
measure the pressure are "Inches of Mercury" and "Millibars".
Inches of mercury refers to the height of a column of
mercury measured in hundredths of inches. This is what
you will usually hear from the NOAA Weather Radio or
from your favorite weather or news source. At sea level,
standard air pressure is 29.92 inches of mercury.
Millibars comes from the original term for pressure
"bar". Bar is from the Greek "báros" meaning weight. A
millibar is 1/1000th of a bar and is approximately equal
to 1000 dynes (one dyne is the amount of force it takes
to accelerate an object with a mass of one gram at the
rate of one centimeter per second squared). Millibar
values used in meteorology range from about 100 to 1050.
At sea level, standard air pressure in millibars is
1013.2. Weather maps showing the pressure at the surface
are drawn using millibars. |
|
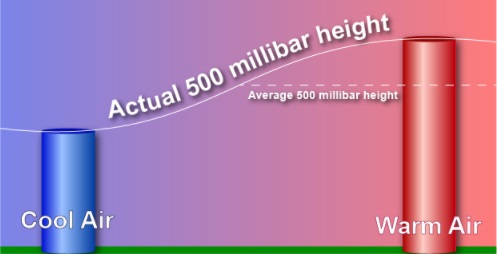 |
| How temperature
effects the height of pressure. |
Although the changes are usually too slow to
observe directly, air pressure is almost always
changing. This change in pressure is caused by changes
in air density, and air density is related to
temperature.
Warm air is less dense than cooler air because the gas
molecules in warm air have a greater velocity and are
farther apart than in cooler air. So, while the average
altitude of the 500 millibar level is around 18,000 feet
(5,600 meters) the actual elevation will be higher in
warm air than in cold air. |
|
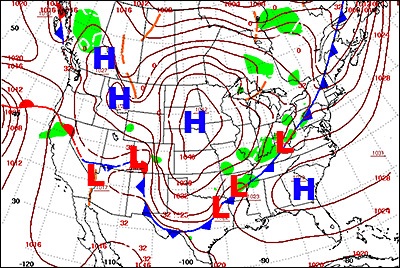 |
The H's represent
the location of the area of highest pressure.
The L's represent the position of the lowest
pressure. |
The most basic change in pressure is the
twice daily rise and fall in due to the heating from the
sun. Each day, around 4 a.m./p.m. the pressure is at its
lowest and near its peak around 10 a.m./p.m. The
magnitude of the daily cycle is greatest near the
equator decreasing toward the poles.
On top of the daily fluctuations are the larger pressure
changes as a result of the migrating weather systems.
These weather systems are identified by the blue H's and
red L's seen on weather maps.
How are changes in weather related to changes in
pressure?
From his vantage point in England in 1848, Rev. Dr.
Brewer wrote in his A Guide to the Scientific Knowledge
of Things Familiar the following about the relation of
pressure to weather:
The FALL of the barometer (decreasing pressure) |
- In very hot weather, the fall of
the barometer denotes thunder. Otherwise, the sudden
falling of the barometer denotes high wind.
- In frosty weather, the fall of
the barometer denotes thaw.
- If wet weather happens soon
after the fall of the barometer, expect but little
of it.
- In wet weather if the barometer
falls expect much wet.
- In fair weather, if the
barometer falls much and remains low, expect much
wet in a few days, and probably wind.
- The barometer sinks lowest of
all for wind and rain together; next to that wind,
(except it be an east or north-east wind).
|
|
The RISE of the barometer (increasing pressure) |
- In winter, the rise of the barometer
presages frost.
- In frosty weather, the rise of the
barometer presages snow.
- If fair weather happens soon after
the rise of the barometer, expect but little of it.
- In wet weather, if the mercury rises
high and remains so, expect continued fine weather in a
day or two.
- In wet weather, if the mercury rises
suddenly very high, fine weather will not last long.
- The barometer rises highest of all
for north and east winds; for all other winds it sinks.
|
|
The barometer UNSETTLED (unsteady pressure) |
- If the motion of the mercury be
unsettled, expect unsettled weather.
- If it stands at "MUCH RAIN" and
rises to "CHANGEABLE" expect fair weather of short
continuance.
- If it stands at "FAIR" and falls to
"CHANGEABLE", expect foul weather.
- Its motion upwards, indicates the
approach of fine weather; its motion downwards,
indicates the approach of foul weather.
|
These pressure observations hold true for many other
locations as well but not all of them. Storms that occur in
England, located near the end of the Gulf Stream, bring
large pressure changes. In the United States, the largest
pressure changes associated with storms will generally occur
in Alaska and northern half of the continental U.S. In the
tropics, except for tropical cyclones, there is very little
day-to-day pressure change and none of the rules apply.
Fast Facts
The scientific unit of pressure is the Pascal (Pa) named
after Blaise Pascal (1623-1662). One pascal equals 0.01
millibar or 0.00001 bar. Meteorology has used the millibar
for air pressure since 1929.
When the change to scientific unit occurred in the 1960's
many meteorologists preferred to keep using the magnitude
they are used to and use a prefix "hecto" (h), meaning 100.
Therefore, 1 hectopascal (hPa) equals 100 Pa which equals 1
millibar. 100,000 Pa equals 1000 hPa which equals 1000
millibars.
The end result is although the units we refer to in
meteorology may be different, their numerical value remains
the same. The standard pressure at sea-level is 1013.25 in
both millibars (mb) and hectopascal (hPa).
|
|
|
|
|
|
|
|
|
|
|
|
|
|
|
|
|
|
|
Search Fun Easy English |
|
|
|
|
|
|
|
|
|
|
|
|
|
|
|
About
Contact
Copyright
Resources
Site Map |