|
|
| |
|
|
| |
|
|
|
|
| |
 Climate Change Indicators: Antarctic
Sea Ice Climate Change Indicators: Antarctic
Sea Ice
This indicator tracks the extent of sea ice around
Antarctica.
Key Points
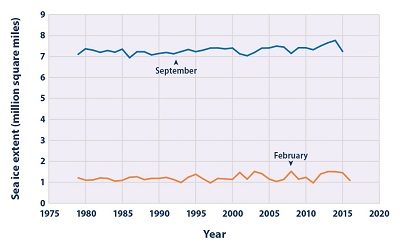
Antarctic sea ice extent in September and February has
increased somewhat over time, although the most recent year
was below average. The September maximum extent reached the
highest level on record in 2014—about 7 percent larger than
the 1981–2010 average—but in 2015 it was slightly below the
1981–2010 average. As for February extent, 2013, 2014, and
2015 were three of the six largest years on record, but
extent in 2016 was about 9 percent below the 1981–2010
average (see Figure 1).
Slight increases in Antarctic sea ice are outweighed by the
loss of sea ice in the Arctic during the same time period
(see the Arctic Sea Ice indicator). Overall, the Earth has
lost sea ice at an average rate of 13,500 square miles per
year since 1979—equivalent to losing an area larger than the
state of Maryland every year. This decrease affects the
Earth’s energy balance. |
|
Background
The Southern Ocean around Antarctica freezes to form sea ice
every year. This sea ice reaches its maximum extent in
September or early October, around the end of winter in the
Southern Hemisphere. At that point, virtually the entire
continent of Antarctica is surrounded by a ring of sea ice
(see images below). The ice melts in the summer months
(December to February) because of warmer temperatures and
long hours of sunlight. Unlike the Arctic, where a large
area of sea ice lasts year-round (see the Arctic Sea Ice
indicator), the sea ice around Antarctica is thinner and
nearly all of it melts in a typical summer. This happens
because no landmass is present to stop Antarctic sea ice
from breaking up and drifting northward into warmer waters,
where it eventually melts.
Like Arctic sea ice, Antarctic sea ice affects global
climate, regional climate, and ecosystems. Because ice is
more reflective than liquid water, it plays a significant
role in maintaining the Earth’s energy balance and helping
to keep polar regions cool. (For more information on how the
color of the Earth's surface affects the absorption of
sunlight, see the Snow Cover indicator.) Sea ice also keeps
the air cool by forming a barrier between the cold air above
and the warmer water below. Antarctic sea ice is an
important part of the habitat for penguins, seals, and other
animals.
Warmer air and ocean temperatures are generally expected to
reduce the amount of sea ice present worldwide. While
warming has already driven a noticeable decline in sea ice
in the Arctic, extent in the Antarctic as a whole has not
yet declined (and has actually increased slightly), which
may reflect influences of wind patterns, ocean currents, and
precipitation around the continent. |
|
About the Indicator
Figure 1 shows Antarctic sea ice extent from 1979, when
routine monitoring by satellites started, to early 2016. Sea
ice extent is defined as the area of ocean where at least 15
percent of the surface is frozen. This threshold was chosen
because scientists have found that it gives the best
approximation of the edge of the ice. Data are collected
throughout the year, but for comparison, this indicator
focuses on the months when sea ice typically reaches its
minimum and maximum extent. February is typically when the
sea ice extent reaches its annual minimum after melting
during the spring and summer. The ice typically reaches its
maximum extent in late September or early October after
winter freezing, with the largest monthly average extent
occurring in September. Data for this indicator were
gathered by the National Snow and Ice Data Center using
satellite imaging technology and data processing methods
developed by the National Aeronautics and Space
Administration.
Unlike EPA’s Arctic Sea Ice indicator, this indicator does
not show the age of Antarctic sea ice. This is because
nearly all of the Antarctic ice melts every summer, unlike
the Arctic, where a large portion of ice survives for
multiple years.
Indicator Notes
Compared with the noticeable decrease in Arctic sea ice
extent (see the Arctic Sea Ice indicator), the increase in
Antarctic sea ice is small. Many factors appear to be
influencing Antarctic sea ice extent, including changes in
wind patterns, currents, and precipitation. Without better
ice thickness and ice volume estimates, it is difficult to
characterize how the total amount of Antarctic sea ice is
responding to climate change.
Data Sources
The data for this indicator were provided by the National
Snow and Ice Data Center. These data are also available
online at:
https://nsidc.org/data/seaice_index/archives.html. The
National Snow and Ice Data Center produces a variety of
reports analyzing sea ice data.
Technical Documentation
Download related technical information PDF |
|
 Figure
1. February and September Monthly Average Antarctic
Sea Ice Extent, 1979–2016 Figure
1. February and September Monthly Average Antarctic
Sea Ice Extent, 1979–2016
This figure shows Antarctic sea ice extent for the months of
February and September of each year from 1979 through
September 2015 and February 2016. The minimum and maximum
sea ice extent typically occur in February and September
each year.
Data source: NSIDC, 20164 |
 Seasonal
Antarctic Sea Ice Seasonal
Antarctic Sea Ice
Source: NASA, 20165 |
|
|
|
EPA Page |
|
This is the
EPA page for this topic. To see if the Trump
administration has changed the EPA page, simply click the
link and compare the information with this page. If you
notice changes were made to the EPA page, please post a
comment. Thanks. |
|
|
|
|
|
|
|
|
|
|
|
|
Additional Climate Change Information |
Climate Change and Carbon Dioxide
(Beginner - Listening,
reading)
A video lesson to
help with your understanding of climate change
and carbon dioxide.
The English is
spoken at 75% of normal speed.
Great English listening and reading practice. |
Carbon Dioxide and Climate Change
(Beginner - Listening,
reading)
A video lesson to
help with your understanding of carbon dioxide
and climate change.
The English is
spoken at 75% of normal speed.
Great English listening and reading practice. |
Environmental Group Warns Earth's Health at Risk
(Beginner - Listening,
reading)
A video lesson to
help with your understanding of climate change.
The English is
spoken at 75% of normal speed.
Great English listening and reading practice.
A report by the World Wildlife Fund looked at thousands of animal populations
and found they have dropped significantly in 40 years. |
Sea Levels Rising at Fastest Rate in 3,000 years
(Beginner - Listening,
reading)
A video lesson to
help with your understanding of climate change.
The English is
spoken at 75% of normal speed.
Great English listening and reading practice.
A group of scientists say sea levels are rising at record rates. Another group
found that January temperatures in the Arctic reached a record high. |
Capturing CO2 Gas Is Not Easy
(Beginner - Listening,
reading)
A video lesson to
help with your understanding of climate change.
The English is
spoken at 75% of normal speed.
Great English listening and reading practice.
Most scientists agree that carbon-dioxide gas is partly to blame for climate
change: rising global temperatures. But capturing the CO2 gas released by power
stations is costly and difficult. |
Growth, Climate Change Threaten African Plants and
Animals
(Beginner - Listening,
reading)
A video lesson to
help with your understanding of climate change.
The English is
spoken at 75% of normal speed.
Great English listening and reading practice.
Researchers believe Africa may lose as much as 30 percent of its animal and
plant species by the end of this century. |
|
|
|
|
Search Fun Easy English |
|
|
|
|
|
|
|
|
|
|
|
|
|
|
|
About
Contact
Copyright
Resources
Site Map |