|
|
| |
|
|
| |
|
|
|
|
| |
 Climate Change Indicators: Bird
Wintering Ranges Climate Change Indicators: Bird
Wintering Ranges
This indicator examines changes in the winter ranges of
North American birds.
Key Points
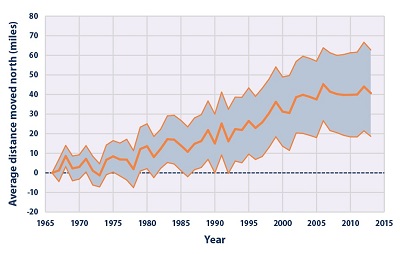
Among 305 widespread North American bird species, the
average mid-December to early January center of abundance
moved northward by more than 40 miles between 1966 and 2013
(see Figure 1). Trends in the center of abundance moving
northward can be closely related to increasing winter
temperatures.
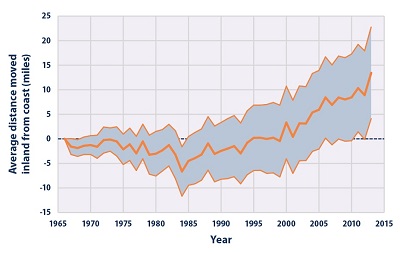
On average, bird species have also moved their wintering
grounds farther from the coast since the 1960s (see Figure
2). A shift away from the coasts can also relate to changes
in winter temperatures. Inland areas tend to experience more
extreme cold than coastal areas, but those extremes are
becoming less severe as the climate warms overall.
Some species have moved farther than others. A total of 48
species have moved northward by more than 200 miles. Of the
305 species studied, 186 (61 percent) have shifted their
wintering grounds northward since the 1960s, while 82 (27
percent) have shifted southward. Some others have not moved
at all. |
|
Background
Changes in climate can affect ecosystems by influencing
animal behavior and ranges. Birds are a particularly good
indicator of environmental change for several reasons:
Each species of bird has adapted or evolved to favor certain
habitat types, food sources, and temperature ranges. In
addition, the timing of certain events in their life
cycles—such as migration and reproduction—is driven by cues
from the environment. For example, many North American birds
follow a regular seasonal migration pattern, moving north to
feed and breed in the summer, then moving south to spend the
winter in warmer areas. Changing conditions can influence
the distribution of both migratory and non-migratory birds
as well as the timing of important life cycle events.
Birds are easy to identify and count, and thus there is a
wealth of scientific knowledge about their distribution and
abundance. People have kept detailed records of bird
observations for more than a century.
There are many different species of birds living in a
variety of habitats, including water birds, coastal birds,
and land birds. If a change in behavior or range occurs
across a range of bird types, it suggests that a common
external factor might be the cause.
Temperature and precipitation patterns are changing across
the United States (see the U.S. and Global Temperature
indicator and the U.S. and Global Precipitation indicator).
Some bird species can adapt to generally warmer temperatures
by changing where they live—for example, by migrating
farther north in the summer but not as far south in the
winter, or by shifting inland as winter temperature extremes
grow less severe. Non-migratory species might shift as well,
expanding into newly suitable habitats while moving out of
areas that become less suitable. Other types of birds might
not adapt to changing conditions and could experience a
population decline as a result. Climate change can also
alter the timing of events that are based on temperature
cues, such as migration and breeding (especially
egg-laying). |
|
About the Indicator
This indicator looks collectively at the “center of
abundance” of hundreds of widespread North American bird
species over a 48-year period. The center of abundance is a
point on the map that represents the middle of each species’
distribution. If a whole population of birds were to shift
generally northward, one would see the center of abundance
shift northward as well.
For year-to-year consistency, this indicator uses
observations from the National Audubon Society’s Christmas
Bird Count, which takes place every year in early winter.
The Christmas Bird Count is a long-running citizen-science
program in which individuals are organized by the National
Audubon Society, Bird Studies Canada, local Audubon
chapters, and other bird clubs to identify and count bird
species. The data presented in this indicator were collected
from more than 2,000 locations throughout the United States
and parts of Canada. At each location, skilled observers
follow a standard counting procedure to estimate the number
of birds within a 15-mile diameter “count circle” over a
24-hour period. Study methods remain generally consistent
from year to year. Data produced by the Christmas Bird Count
go through several levels of review before Audubon
scientists analyze the final data, which have been used to
support a wide variety of peer-reviewed studies.
Indicator Notes
Many factors can influence bird ranges, including food
availability, habitat alteration, and interactions with
other species. As a result, some of the birds included in
this indicator might have moved north for reasons other than
changing temperatures. This indicator does not show how
responses to climate change vary among different types of
birds. For example, a more detailed National Audubon Society
analysis found large differences among coastal birds,
grassland birds, and birds adapted to feeders, which all
have different abilities to adapt to temperature changes.
Some data variations can be caused by differences among
count circles, such as inconsistent level of effort by
volunteer observers, but these differences are carefully
corrected in Audubon’s statistical analysis.
Data Sources
Bird center-of-abundance data were collected by the annual
Christmas Bird Count organized by the National Audubon
Society and Bird Studies Canada. Recent and historical
Christmas Bird Count data are available at:
www.audubon.org/conservation/science/christmas-bird-count.
The National Audubon Society published a previous version of
this analysis in 2009,7 available at:
https://web4.audubon.org/bird/bacc/index.html.
Technical Documentation
Download related technical information PDF |
|
 Figure
1. Change in Latitude of Bird Center of Abundance,
1966–2013 Figure
1. Change in Latitude of Bird Center of Abundance,
1966–2013
This figure shows annual change in latitude of bird center
of abundance for 305 widespread bird species in North
America from 1966 to 2013. Each winter is represented by the
year in which it began (for example, winter 2013–2014 is
shown as 2013). The shaded band shows the likely range of
values, based on the number of measurements collected and
the precision of the methods used.
Data source: National Audubon Society, 20144 |
 Figure
2. Change in Distance to Coast of Bird Center of
Abundance, 1966–2013 Figure
2. Change in Distance to Coast of Bird Center of
Abundance, 1966–2013
This figure shows annual change in distance to the coast of
bird center of abundance for 272 widespread bird species in
North America from 1966 to 2013. This figure covers 272
species instead of the 305 species shown in Figure 1 because
33 of the species in Figure 1 need access to salt water,
which means they cannot move inland. Each winter is
represented by the year in which it began (for example,
winter 2013–2014 is shown as 2013). The shaded band shows
the likely range of values, based on the number of
measurements collected and the precision of the methods
used.
Data source: National Audubon Society, 20145 |
|
|
|
EPA Page |
|
This is the
EPA page for this topic. To see if the Trump
administration has changed the EPA page, simply click the
link and compare the information with this page. If you
notice changes were made to the EPA page, please post a
comment. Thanks. |
|
|
|
|
|
|
|
|
|
|
|
|
Additional Climate Change Information |
Climate Change and Carbon Dioxide
(Beginner - Listening,
reading)
A video lesson to
help with your understanding of climate change
and carbon dioxide.
The English is
spoken at 75% of normal speed.
Great English listening and reading practice. |
Carbon Dioxide and Climate Change
(Beginner - Listening,
reading)
A video lesson to
help with your understanding of carbon dioxide
and climate change.
The English is
spoken at 75% of normal speed.
Great English listening and reading practice. |
Environmental Group Warns Earth's Health at Risk
(Beginner - Listening,
reading)
A video lesson to
help with your understanding of climate change.
The English is
spoken at 75% of normal speed.
Great English listening and reading practice.
A report by the World Wildlife Fund looked at thousands of animal populations
and found they have dropped significantly in 40 years. |
Sea Levels Rising at Fastest Rate in 3,000 years
(Beginner - Listening,
reading)
A video lesson to
help with your understanding of climate change.
The English is
spoken at 75% of normal speed.
Great English listening and reading practice.
A group of scientists say sea levels are rising at record rates. Another group
found that January temperatures in the Arctic reached a record high. |
Capturing CO2 Gas Is Not Easy
(Beginner - Listening,
reading)
A video lesson to
help with your understanding of climate change.
The English is
spoken at 75% of normal speed.
Great English listening and reading practice.
Most scientists agree that carbon-dioxide gas is partly to blame for climate
change: rising global temperatures. But capturing the CO2 gas released by power
stations is costly and difficult. |
Growth, Climate Change Threaten African Plants and
Animals
(Beginner - Listening,
reading)
A video lesson to
help with your understanding of climate change.
The English is
spoken at 75% of normal speed.
Great English listening and reading practice.
Researchers believe Africa may lose as much as 30 percent of its animal and
plant species by the end of this century. |
|
|
|
|
Search Fun Easy English |
|
|
|
|
|
|
|
|
|
|
|
|
|
|
|
About
Contact
Copyright
Resources
Site Map |