|
|
| |
|
|
| |
|
|
| Great Lakes Water Levels and Temperatures |
|
| |
 Climate Change Indicators: Great
Lakes Water Levels and Temperatures Climate Change Indicators: Great
Lakes Water Levels and Temperatures
This indicator measures water levels and surface water
temperatures in the Great Lakes.
Key Points
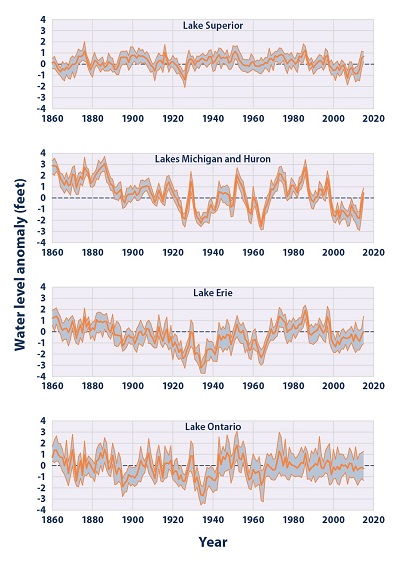
Water levels in the Great Lakes have fluctuated since 1860.
Over the last few decades, they appear to have declined for
most of the Great Lakes (see Figure 1). The most recent
levels, however, are all within the range of historical
variation.
Since 1995, average surface water temperatures have
increased slightly for each of the Great Lakes (see Figure
2).
Recent increases in water temperature have mostly been
driven by warming during the spring and summer months (see
Figure 2). These trends could relate in part to an earlier
thawing of winter ice (see the Lake Ice indicator). |
|
Background
The Great Lakes, which are Lake Superior, Lake Michigan,
Lake Huron, Lake Erie, and Lake Ontario, form the largest
group of freshwater lakes on Earth. These lakes support a
variety of ecosystems and play a vital role in the economy
of the eight neighboring states and the Canadian province of
Ontario, providing drinking water, shipping lanes,
fisheries, recreational opportunities, and more.
Water level and water temperature are two important and
interrelated indicators of weather and climate change in the
Great Lakes. Water level (the height of the lake surface
above sea level) is influenced by many factors, including
precipitation, snowmelt runoff, drought, evaporation rates,
and people withdrawing water for multiple uses. Water
temperature is influenced by many factors, too, but most
directly by air temperature.
In recent years, warmer surface water temperatures in the
Great Lakes have contributed to lower water levels by
increasing rates of evaporation and causing lake ice to form
later than usual (see the Lake Ice indicator), which extends
the season for evaporation.1 Lower water levels in the Great
Lakes forced ships to reduce their cargo tonnage by 5 to 8
percent between 1997 and 2000, which increased shipping
costs. Lower water levels can also affect water supplies,
the usability of infrastructure such as docks and piers, and
shoreline ecosystems. These types of disruptions from low
water levels are expected to continue as the climate
changes.
Another possible effect of warmer water, reduced ice cover,
and increased evaporation is a corresponding increase in
precipitation over nearby land, especially “lake effect”
snow (see the Snowfall indicator).3 Rising water
temperatures are also expected to expand the ranges of and
give new advantages to some invasive species such as the
zebra mussel, and to encourage the growth of certain
waterborne bacteria that can make people ill. |
|
About the Indicator
This indicator analyzes water levels and surface water
temperatures in the Great Lakes. Water levels are recorded
by gauges along the shore of each lake, some of which have
been operated since the 1800s. Pre-1918 data came from one
water level gauge per lake. Data since 1918 have come from a
designated set of gauges in each lake. Figure 1 shows annual
water level anomalies, or differences, in feet compared with
the average water levels in each lake from 1860 to 2015.
Lakes Michigan and Huron are combined because they are
connected at the same water level.
Surface water temperatures are measured by satellites.
Figure 2 shows annual average temperatures over the entire
surface of each lake, along with the pattern of daily
temperatures over the course of the year. This figure’s data
begin in 1995, which was the first year with complete
satellite data for all five lakes.
Indicator Notes
While climate change influences water levels, human
activities such as dredging can also play a role. For
example, the St. Clair river opening was enlarged in the
1910s, 1930s, and 1960s, contributing to greater outflows
from Lakes Michigan and Huron. Similarly, natural
year-to-year variability and other factors such as human use
and wastewater discharges can influence water temperatures.
Data Sources
Water level data were provided by the Canadian Hydrographic
Service and the National Oceanic and Atmospheric
Administration’s Center for Operational Oceanographic
Products and Services, and can be downloaded from:
www.glerl.noaa.gov/data/dashboard/data. Surface water
temperature data were provided by the National Oceanic and
Atmospheric Administration’s Great Lakes Environmental
Research Laboratory (satellite data at:
https://coastwatch.glerl.noaa.gov).
Technical Documentation
Download related technical information PDF |
|
 Figure
1. Water Levels of the Great Lakes, 1860–2015 Figure
1. Water Levels of the Great Lakes, 1860–2015
This figure displays how water levels in each of the Great
Lakes have changed since 1860. For each year, the shaded
band shows the range of monthly average water levels, and
the line in the middle shows the annual average. The graph
uses the 1981 to 2010 average as a baseline for depicting
change. Choosing a different baseline period would not
change the shape of the data over time. Lakes Michigan and
Huron are shown together because they are connected at the
same water level.
Data source: NOAA, 20166 |
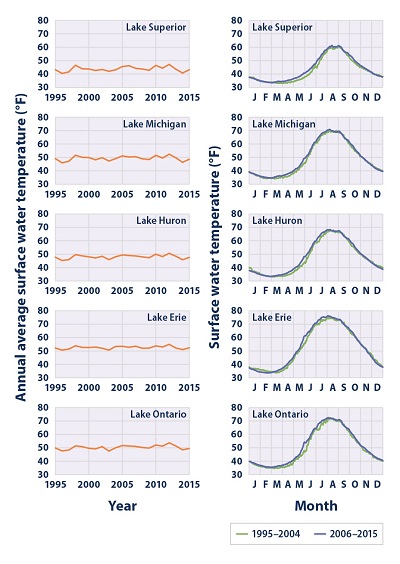 Figure
2. Surface Water Temperatures of the Great Lakes,
1995–2015 Figure
2. Surface Water Temperatures of the Great Lakes,
1995–2015
This figure shows the average surface water temperatures in
each of the Great Lakes, as measured by satellites. The
graphs on the left show annual averages for the full time
period, while the graphs on the right show how average daily
temperatures have changed between two time periods for
comparison: 2006–2015 versus 1995–2004.
Data source: NOAA, 20167 |
|
|
|
EPA Page |
|
This is the
EPA page for this topic. To see if the Trump
administration has changed the EPA page, simply click the
link and compare the information with this page. If you
notice changes were made to the EPA page, please post a
comment. Thanks. |
|
|
|
|
|
|
|
|
|
|
|
|
Additional Climate Change Information |
Climate Change and Carbon Dioxide
(Beginner - Listening,
reading)
A video lesson to
help with your understanding of climate change
and carbon dioxide.
The English is
spoken at 75% of normal speed.
Great English listening and reading practice. |
Carbon Dioxide and Climate Change
(Beginner - Listening,
reading)
A video lesson to
help with your understanding of carbon dioxide
and climate change.
The English is
spoken at 75% of normal speed.
Great English listening and reading practice. |
Environmental Group Warns Earth's Health at Risk
(Beginner - Listening,
reading)
A video lesson to
help with your understanding of climate change.
The English is
spoken at 75% of normal speed.
Great English listening and reading practice.
A report by the World Wildlife Fund looked at thousands of animal populations
and found they have dropped significantly in 40 years. |
Sea Levels Rising at Fastest Rate in 3,000 years
(Beginner - Listening,
reading)
A video lesson to
help with your understanding of climate change.
The English is
spoken at 75% of normal speed.
Great English listening and reading practice.
A group of scientists say sea levels are rising at record rates. Another group
found that January temperatures in the Arctic reached a record high. |
Capturing CO2 Gas Is Not Easy
(Beginner - Listening,
reading)
A video lesson to
help with your understanding of climate change.
The English is
spoken at 75% of normal speed.
Great English listening and reading practice.
Most scientists agree that carbon-dioxide gas is partly to blame for climate
change: rising global temperatures. But capturing the CO2 gas released by power
stations is costly and difficult. |
Growth, Climate Change Threaten African Plants and
Animals
(Beginner - Listening,
reading)
A video lesson to
help with your understanding of climate change.
The English is
spoken at 75% of normal speed.
Great English listening and reading practice.
Researchers believe Africa may lose as much as 30 percent of its animal and
plant species by the end of this century. |
|
|
|
|
Search Fun Easy English |
|
|
|
|
|
|
|
|
|
|
|
|
|
|
|
About
Contact
Copyright
Resources
Site Map |