|
|
| |
|
|
| |
|
|
|
|
| |
 Climate Change Indicators: Heavy
Precipitation Climate Change Indicators: Heavy
Precipitation
This indicator tracks the frequency of heavy precipitation
events in the United States.
Key Points
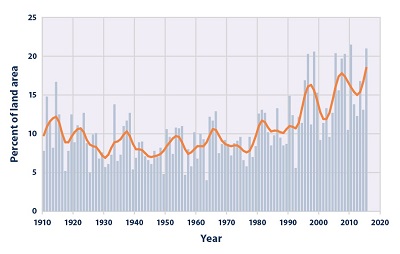
In recent years, a larger percentage of precipitation has
come in the form of intense single-day events. Nine of the
top 10 years for extreme one-day precipitation events have
occurred since 1990 (see Figure 1).
The prevalence of extreme single-day precipitation events
remained fairly steady between 1910 and the 1980s, but has
risen substantially since then. Over the entire period from
1910 to 2015, the portion of the country experiencing
extreme single-day precipitation events increased at a rate
of about half a percentage point per decade (see Figure 1).
The percentage of land area experiencing much greater than
normal yearly precipitation totals increased between 1895
and 2015. There has been much year-to-year variability,
however. In some years there were no abnormally wet areas,
while a few others had abnormally high precipitation totals
over 10 percent or more of the contiguous 48 states’ land
area (see Figure 2). For example, 1941 was extremely wet in
the West, while 1982 was very wet nationwide.
Figures 1 and 2 are both consistent with other studies that
have found an increase in heavy precipitation over
timeframes ranging from single days to 90-day periods to
whole years. For more information on trends in overall
precipitation levels, see the U.S. and Global Precipitation
indicator. |
|
Background
Heavy precipitation refers to instances during which the
amount of rain or snow experienced in a location
substantially exceeds what is normal. What constitutes a
period of heavy precipitation varies according to location
and season.
Climate change can affect the intensity and frequency of
precipitation. Warmer oceans increase the amount of water
that evaporates into the air. When more moisture-laden air
moves over land or converges into a storm system, it can
produce more intense precipitation—for example, heavier rain
and snow storms.1 The potential impacts of heavy
precipitation include crop damage, soil erosion, and an
increase in flood risk due to heavy rains (see the River
Flooding indicator)—which in turn can lead to injuries,
drownings, and other flooding-related effects on health.2 In
addition, runoff from precipitation can impair water quality
as pollutants deposited on land wash into water bodies.
Heavy precipitation does not necessarily mean the total
amount of precipitation at a location has increased—just
that precipitation is occurring in more intense events.
However, changes in the intensity of precipitation, when
combined with changes in the interval between precipitation
events, can also lead to changes in overall precipitation
totals. |
|
About the Indicator
Heavy precipitation events can be measured by tracking their
frequency, examining their return period (the chance that
the event will be equaled or exceeded in a given year), or
directly measuring the amount of precipitation in a certain
period (for example, inches of rain falling in a 24-hour
period).
One way to track heavy precipitation is by calculating what
percentage of a particular location’s total precipitation in
a given year has come in the form of extreme one-day
events—or, in other words, what percentage of precipitation
is arriving in short, intense bursts. Figure 1 of this
indicator looks at the prevalence of extreme single-day
precipitation events over time.
For added insight, this indicator also tracks the occurrence
of unusually high total yearly precipitation. It does so by
looking at the Standardized Precipitation Index (SPI), which
compares actual yearly precipitation totals with the range
of precipitation totals that one would typically expect at a
specific location, based on historical data. If a location
experiences less precipitation than normal during a
particular period, it will receive a negative SPI score,
while a period with more precipitation than normal will
receive a positive score. The more precipitation (compared
with normal), the higher the SPI score. The SPI is a useful
way to look at precipitation totals because it allows
comparison of different locations and different seasons on a
standard scale. Figure 2 shows what percentage of the total
area of the contiguous 48 states had an annual SPI score of
2.0 or above (well above normal) in any given year.
Indicator Notes
Weather monitoring stations tend to be closer together in
the eastern and central states than in the western states.
In areas with fewer monitoring stations, heavy precipitation
indicators are less likely to reflect local conditions
accurately.
Data Sources
The data used for this indicator come from a large national
network of weather stations and were provided by the
National Oceanic and Atmospheric Administration’s (NOAA’s)
National Centers for Environmental Information. Figure 1 is
based on Step #4 of NOAA’s U.S. Climate Extremes Index; for
data and a description of the index, see:
www.ncdc.noaa.gov/extremes/cei. Figure 2 is based on the
U.S. SPI, which is shown in a variety of maps available
online at:
www.ncdc.noaa.gov/sotc/drought. The data used to
construct these maps are available at:
ftp://ftp.ncdc.noaa.gov/pub/data/cirs/climdiv/.
Technical Documentation
Download related technical information PDF |
|
 Figure
1. Extreme One-Day Precipitation Events in the
Contiguous 48 States, 1910–2015 Figure
1. Extreme One-Day Precipitation Events in the
Contiguous 48 States, 1910–2015
This figure shows the percentage of the land area of the
contiguous 48 states where a much greater than normal
portion of total annual precipitation has come from extreme
single-day precipitation events. The bars represent
individual years, while the line is a nine-year weighted
average.
Data source: NOAA, 20166 |
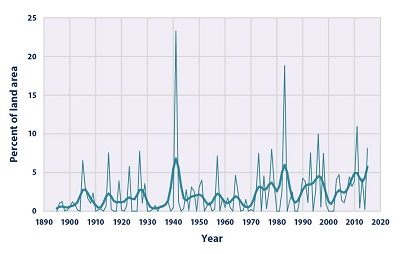 Figure
2. Unusually High Annual Precipitations in the
Contiguous 48 States, 1895–2015 Figure
2. Unusually High Annual Precipitations in the
Contiguous 48 States, 1895–2015
This figure shows the percentage of the land area of the
contiguous 48 states that experienced much greater than
normal precipitation in any given year, which means it
scored 2.0 or above on the annual Standardized Precipitation
Index. The thicker line shows a nine-year weighted average
that smooths out some of the year-to-year fluctuations.
Data source: NOAA, 20167 |
|
|
|
EPA Page |
|
This is the
EPA page for this topic. To see if the Trump
administration has changed the EPA page, simply click the
link and compare the information with this page. If you
notice changes were made to the EPA page, please post a
comment. Thanks. |
|
|
|
|
|
|
|
|
|
|
|
|
Additional Climate Change Information |
Climate Change and Carbon Dioxide
(Beginner - Listening,
reading)
A video lesson to
help with your understanding of climate change
and carbon dioxide.
The English is
spoken at 75% of normal speed.
Great English listening and reading practice. |
Carbon Dioxide and Climate Change
(Beginner - Listening,
reading)
A video lesson to
help with your understanding of carbon dioxide
and climate change.
The English is
spoken at 75% of normal speed.
Great English listening and reading practice. |
Environmental Group Warns Earth's Health at Risk
(Beginner - Listening,
reading)
A video lesson to
help with your understanding of climate change.
The English is
spoken at 75% of normal speed.
Great English listening and reading practice.
A report by the World Wildlife Fund looked at thousands of animal populations
and found they have dropped significantly in 40 years. |
Sea Levels Rising at Fastest Rate in 3,000 years
(Beginner - Listening,
reading)
A video lesson to
help with your understanding of climate change.
The English is
spoken at 75% of normal speed.
Great English listening and reading practice.
A group of scientists say sea levels are rising at record rates. Another group
found that January temperatures in the Arctic reached a record high. |
Capturing CO2 Gas Is Not Easy
(Beginner - Listening,
reading)
A video lesson to
help with your understanding of climate change.
The English is
spoken at 75% of normal speed.
Great English listening and reading practice.
Most scientists agree that carbon-dioxide gas is partly to blame for climate
change: rising global temperatures. But capturing the CO2 gas released by power
stations is costly and difficult. |
Growth, Climate Change Threaten African Plants and
Animals
(Beginner - Listening,
reading)
A video lesson to
help with your understanding of climate change.
The English is
spoken at 75% of normal speed.
Great English listening and reading practice.
Researchers believe Africa may lose as much as 30 percent of its animal and
plant species by the end of this century. |
|
|
|
|
Search Fun Easy English |
|
|
|
|
|
|
|
|
|
|
|
|
|
|
|
About
Contact
Copyright
Resources
Site Map |