|
|
| |
|
|
| |
|
|
|
|
| |
 Climate Change Indicators: Lake Ice Climate Change Indicators: Lake Ice
This indicator measures the amount of time that ice is
present on lakes in the United States.
Key Points
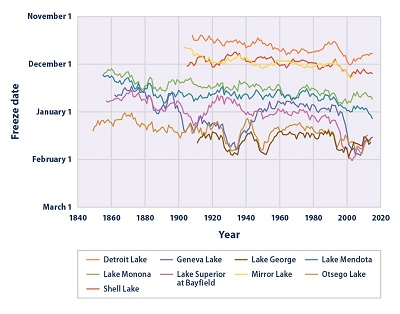
The lakes covered by this indicator are generally freezing
later than they did in the past. Freeze dates have shifted
later at a rate of roughly half a day to one-and-a-half days
per decade (see Figure 1).
Thaw dates for most of these lakes show a trend toward
earlier ice breakup in the spring (see Figure 2). Spring
thaw dates have grown earlier by up to 24 days in the past
110 years (see Figure 3). All of these lakes were found to
be thawing earlier in the year.
The changes in lake freeze and thaw dates shown here are
consistent with other studies. For example, a broad study of
lakes and rivers throughout the Northern Hemisphere found
that since the mid-1800s, freeze dates have occurred later
and thaw dates have occurred earlier, both shifting at an
average rate of 0.8 days to one day per decade. |
|
Background
The formation of ice cover on lakes in the winter and its
disappearance the following spring depends on climate
factors such as air temperature, cloud cover, and wind.
Conditions such as heavy rains or snowmelt in locations
upstream or elsewhere in the watershed also affect the
length of time a lake is frozen. Thus, ice formation and
breakup dates are key indicators of climate change. If lakes
remain frozen for longer periods, it can signify that the
climate is cooling. Conversely, shorter periods of ice cover
suggest a warming climate.
Changes in ice cover can affect the physical, chemical, and
biological characteristics of a body of water. For example,
ice influences heat and moisture transfers between a lake
and the atmosphere. Reduced ice cover leads to increased
evaporation and lower water levels, as well as an increase
in water temperature and sunlight penetration. These
changes, in turn, can affect plant and animal life cycles
and the availability of suitable habitat. Additionally, ice
cover affects the amount of heat that is reflected from the
Earth’s surface. Exposed water will absorb and retain heat,
making the Earth’s surface warmer, whereas an ice- and
snow-covered lake will reflect more of the sun’s energy and
absorb less. (For more information on ice and snow
reflecting sunlight, see the Snow Cover indicator.)
The timing and duration of ice cover on lakes and other
bodies of water can also affect society—particularly in
relation to shipping and transportation, hydroelectric power
generation, and fishing. The impacts can be positive or
negative. For example, reduced ice cover on a large lake
could extend the open-water shipping season but require
vessels to reduce their cargo capacity, as increased
evaporation leads to lower water levels. |
|
About the Indicator
This indicator analyzes the dates at which lakes freeze and
thaw. Freeze dates occur when a continuous and immobile ice
cover forms over a body of water. Thaw dates occur when the
ice cover breaks up and open water becomes extensive.
Freeze and thaw dates have been recorded through human
visual observations for more than 150 years. The National
Snow and Ice Data Center maintains a database with freeze
and thaw observations from more than 700 lakes and rivers
throughout the Northern Hemisphere. This indicator focuses
on 14 lakes within the United States that have the longest
and most complete historical records. The lakes of interest
are located in Minnesota, Wisconsin, New York, and Maine.
Indicator Notes
Although there is a lengthy historical record of freeze and
thaw dates for a much larger set of lakes and rivers, some
records are incomplete, with breaks ranging from brief
lapses to large gaps in data. This indicator is limited to
14 lakes with sufficiently complete historical records. The
four Maine lakes and Lake Osakis only have data for ice
thaw, so they do not appear in Figure 1 (first freeze date).
Data used in this indicator are all based on visual
observations. While the procedures for making observations
of lake ice are consistent over time, visual observations by
individuals are open to some interpretation and can differ
from one individual to the next. In addition, historical
observations for lakes have typically been made from a
particular spot on the shore, which might not be
representative of lakes as a whole or comparable to
satellite-based observations. Considerations for defining
the thaw date are specific to each lake.
Data Sources
Data through 2004 for most lakes were obtained from the
Global Lake and River Ice Phenology Database, which is
maintained by the National Snow and Ice Data Center. These
data are available at:
https://nsidc.org/data/lake_river_ice. More recent data
were obtained from state, local, and other organizations
that collected or compiled the observations.
Technical Documentation
Download related technical information PDF |
|
 Figure
1. Date of First Freeze for Selected U.S. Lakes,
1850–2015 Figure
1. Date of First Freeze for Selected U.S. Lakes,
1850–2015
This figure shows the “ice-on” date, or date of first
freeze, for nine U.S. lakes. The data are available from as
early as 1850 to 2015, depending on the lake, and have been
smoothed using a nine-year moving average.
Data source: Various organizations |
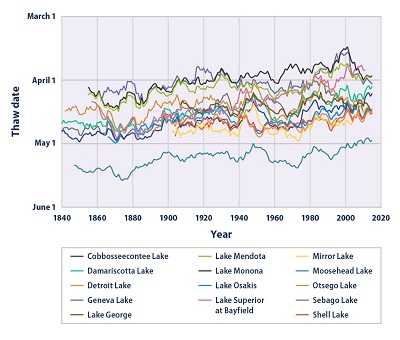 Figure
2. Date of Ice Thaw for Selected U.S. Lakes,
1840–2015 Figure
2. Date of Ice Thaw for Selected U.S. Lakes,
1840–2015
This figure shows the “ice-off” date, or date of ice thawing
and breakup, for 14 U.S. lakes. The data are available from
as early as 1850 to 2015, depending on the lake, and have
been smoothed using a nine-year moving average.
Data source: Various organizations |
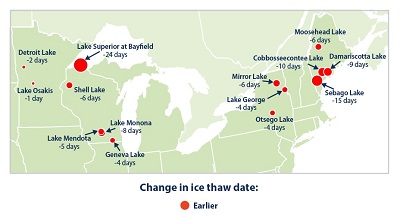 Figure
3. Change in Ice Thaw Dates for Selected U.S. Lakes,
1905–2015 Figure
3. Change in Ice Thaw Dates for Selected U.S. Lakes,
1905–2015
This figure shows the change in the “ice-off” date, or date
of ice thawing and breakup, for 14 U.S. lakes during the
period from 1905 to 2015. All of the lakes have red circles
with negative numbers, which represent earlier thaw dates.
Larger circles indicate larger changes.
Data source: Various organizations |
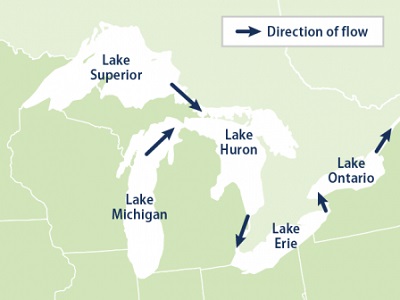 Reference
Map Reference
Map
Reference map for figure 3 above. |
|
|
|
EPA Page |
|
This is the
EPA page for this topic. To see if the Trump
administration has changed the EPA page, simply click the
link and compare the information with this page. If you
notice changes were made to the EPA page, please post a
comment. Thanks. |
|
|
|
|
|
|
|
|
|
|
|
|
Additional Climate Change Information |
Climate Change and Carbon Dioxide
(Beginner - Listening,
reading)
A video lesson to
help with your understanding of climate change
and carbon dioxide.
The English is
spoken at 75% of normal speed.
Great English listening and reading practice. |
Carbon Dioxide and Climate Change
(Beginner - Listening,
reading)
A video lesson to
help with your understanding of carbon dioxide
and climate change.
The English is
spoken at 75% of normal speed.
Great English listening and reading practice. |
Environmental Group Warns Earth's Health at Risk
(Beginner - Listening,
reading)
A video lesson to
help with your understanding of climate change.
The English is
spoken at 75% of normal speed.
Great English listening and reading practice.
A report by the World Wildlife Fund looked at thousands of animal populations
and found they have dropped significantly in 40 years. |
Sea Levels Rising at Fastest Rate in 3,000 years
(Beginner - Listening,
reading)
A video lesson to
help with your understanding of climate change.
The English is
spoken at 75% of normal speed.
Great English listening and reading practice.
A group of scientists say sea levels are rising at record rates. Another group
found that January temperatures in the Arctic reached a record high. |
Capturing CO2 Gas Is Not Easy
(Beginner - Listening,
reading)
A video lesson to
help with your understanding of climate change.
The English is
spoken at 75% of normal speed.
Great English listening and reading practice.
Most scientists agree that carbon-dioxide gas is partly to blame for climate
change: rising global temperatures. But capturing the CO2 gas released by power
stations is costly and difficult. |
Growth, Climate Change Threaten African Plants and
Animals
(Beginner - Listening,
reading)
A video lesson to
help with your understanding of climate change.
The English is
spoken at 75% of normal speed.
Great English listening and reading practice.
Researchers believe Africa may lose as much as 30 percent of its animal and
plant species by the end of this century. |
|
|
|
|
Search Fun Easy English |
|
|
|
|
|
|
|
|
|
|
|
|
|
|
|
About
Contact
Copyright
Resources
Site Map |