|
|
| |
|
|
| |
|
|
| U.S. and Global Precipitation |
|
| |
 Climate Change Indicators: U.S. and
Global Precipitation Climate Change Indicators: U.S. and
Global Precipitation
This indicator describes trends in average precipitation for
the United States and the world.
Key Points
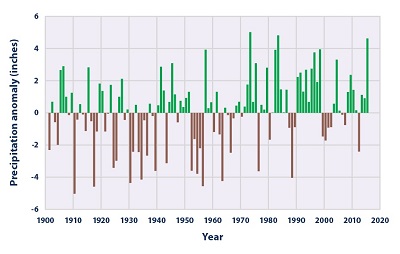
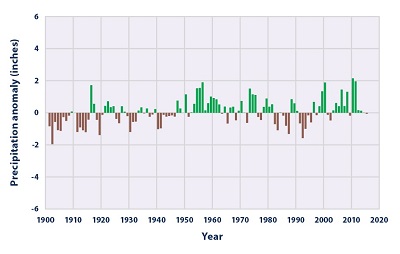
On average, total annual precipitation has increased over
land areas in the United States and worldwide (see Figures 1
and 2). Since 1901, global precipitation has increased at an
average rate of 0.08 inches per decade, while precipitation
in the contiguous 48 states has increased at a rate of 0.17
inches per decade.
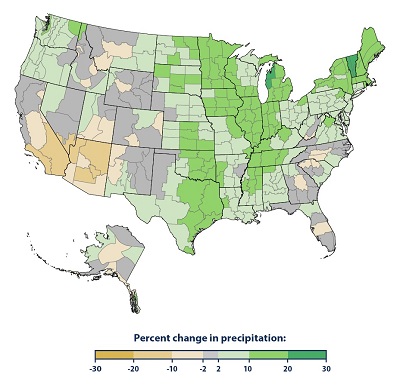
Some parts of the United States have experienced greater
increases in precipitation than others. A few areas, such as
the Southwest, have seen a decrease in precipitation (see
Figure 3). Not all of these regional trends are
statistically significant, however. |
|
Background
Precipitation can have wide-ranging effects on human
well-being and ecosystems. Rainfall, snowfall, and the
timing of snowmelt can all affect the amount of surface
water and groundwater available for drinking, irrigation,
and industry. They also influence river flooding and can
determine what types of animals and plants (including crops)
can survive in a particular place. Changes in precipitation
can disrupt a wide range of natural processes, particularly
if these changes occur more quickly than plant and animal
species can adapt.
As average temperatures at the Earth’s surface rise (see the
U.S. and Global Temperature indicator), more evaporation
occurs, which, in turn, increases overall precipitation.
Therefore, a warming climate is expected to increase
precipitation in many areas. Just as precipitation patterns
vary across the world, however, so do the precipitation
effects of climate change. By shifting the wind patterns and
ocean currents that drive the world’s climate system,
climate change will also cause some areas to experience
decreased precipitation. In addition, higher temperatures
lead to more evaporation, so increased precipitation will
not necessarily increase the amount of water available for
drinking, irrigation, and industry (see the Drought
indicator). |
|
About the Indicator
This indicator examines U.S. and global precipitation
patterns, based on rainfall and snowfall measurements from
land-based weather stations worldwide. This indicator starts
at 1901 except for the detailed map of Alaska, where
reliable statewide records are available back to 1925. The
indicator extends through 2015.
This indicator shows annual anomalies, or differences,
compared with the average precipitation from 1901 to 2000.
At each weather station, annual precipitation anomalies were
calculated from total annual precipitation in inches.
Anomalies for the contiguous 48 states and Alaska have been
determined by calculating average precipitation anomalies
for areas within each state based on station density and
topography. These regional anomalies are then averaged
together in proportion to their area to develop national
results. Similarly, global anomalies have been determined by
dividing the world into a grid, averaging the data for each
cell of the grid, and then averaging the grid cells
together.
Indicator Notes
Data from the early 20th century are somewhat less precise
because there were fewer stations collecting measurements at
the time. To ensure that overall trends are reliable, the
data have been adjusted where possible to account for any
biases that might be introduced by factors such as station
relocation or changes in measurement instruments.
Hawaii and U.S. territories are not included, due to
limitations in available data.
Data Sources
The data for this indicator were provided by the National
Oceanic and Atmospheric Administration’s National Centers
for Environmental Information, which maintains a large
collection of climate data online at:
www.ncei.noaa.gov.
The precipitation anomalies shown here were calculated based
on monthly values from a network of long-term monitoring
stations.
Technical Documentation
Download related technical information PDF |
|
 Figure
1. Precipitation in the Contiguous 48 States,
1901–2015 Figure
1. Precipitation in the Contiguous 48 States,
1901–2015
This figure shows how the total annual amount of
precipitation in the contiguous 48 states has changed since
1901. This graph uses the 1901–2000 average as a baseline
for depicting change. Choosing a different baseline period
would not change the shape of the data over time.
Data source: NOAA, 20161 |
 Figure
2. Precipitation Worldwide, 1901–2015 Figure
2. Precipitation Worldwide, 1901–2015
This figure shows how the total annual amount of
precipitation over land worldwide has changed since 1901.
This graph uses the 1901–2000 average as a baseline for
depicting change. Choosing a different baseline period would
not change the shape of the data over time.
Data source: Blunden and Arndt, 20162 |
 Figure
3. Change in Precipitation in the United States,
1901–2015 Figure
3. Change in Precipitation in the United States,
1901–2015
This figure shows the rate of change in total annual
precipitation in different parts of the United States since
the early 20th century (since 1901 for the contiguous 48
states and 1925 for Alaska). The data are shown for climate
divisions, as defined by the National Oceanic and
Atmospheric Administration.
Data source: NOAA, 20163 |
|
|
|
EPA Page |
|
This is the
EPA page for this topic. To see if the Trump
administration has changed the EPA page, simply click the
link and compare the information with this page. If you
notice changes were made to the EPA page, please post a
comment. Thanks. |
|
|
|
|
|
|
|
|
|
|
|
|
Additional Climate Change Information |
Climate Change and Carbon Dioxide
(Beginner - Listening,
reading)
A video lesson to
help with your understanding of climate change
and carbon dioxide.
The English is
spoken at 75% of normal speed.
Great English listening and reading practice. |
Carbon Dioxide and Climate Change
(Beginner - Listening,
reading)
A video lesson to
help with your understanding of carbon dioxide
and climate change.
The English is
spoken at 75% of normal speed.
Great English listening and reading practice. |
Environmental Group Warns Earth's Health at Risk
(Beginner - Listening,
reading)
A video lesson to
help with your understanding of climate change.
The English is
spoken at 75% of normal speed.
Great English listening and reading practice.
A report by the World Wildlife Fund looked at thousands of animal populations
and found they have dropped significantly in 40 years. |
Sea Levels Rising at Fastest Rate in 3,000 years
(Beginner - Listening,
reading)
A video lesson to
help with your understanding of climate change.
The English is
spoken at 75% of normal speed.
Great English listening and reading practice.
A group of scientists say sea levels are rising at record rates. Another group
found that January temperatures in the Arctic reached a record high. |
Capturing CO2 Gas Is Not Easy
(Beginner - Listening,
reading)
A video lesson to
help with your understanding of climate change.
The English is
spoken at 75% of normal speed.
Great English listening and reading practice.
Most scientists agree that carbon-dioxide gas is partly to blame for climate
change: rising global temperatures. But capturing the CO2 gas released by power
stations is costly and difficult. |
Growth, Climate Change Threaten African Plants and
Animals
(Beginner - Listening,
reading)
A video lesson to
help with your understanding of climate change.
The English is
spoken at 75% of normal speed.
Great English listening and reading practice.
Researchers believe Africa may lose as much as 30 percent of its animal and
plant species by the end of this century. |
|
|
|
|
Search Fun Easy English |
|
|
|
|
|
|
|
|
|
|
|
|
|
|
|
About
Contact
Copyright
Resources
Site Map |