|
|
| |
|
|
| |
|
|
|
|
| |
 Climate Change Indicators: Wildfires Climate Change Indicators: Wildfires
This indicator tracks the frequency, extent, and severity of
wildfires in the United States.
Key Points
Since 1983, the National Interagency Fire Center has
documented an average of 72,000 wildfires per year (see
Figure 1). Compiled data from the Forest Service suggest
that the actual total may be even higher for the first few
years of nationwide data collection that can be compared.
The data do not show an obvious trend during this time.
The extent of area burned by wildfires each year appears to
have increased since the 1980s. According to National
Interagency Fire Center data, of the 10 years with the
largest acreage burned, nine have occurred since 2000,
including the peak year in 2015 (see Figure 2). This period
coincides with many of the warmest years on record
nationwide (see the U.S. and Global Temperature indicator).
The late 1990s were a period of transition in certain
climate cycles that tend to shift every few decades.10 This
shift—combined with other ongoing changes in temperature,
drought, and snowmelt—may have contributed to warmer, drier
conditions that have fueled wildfires in parts of the
western United States.
Of the total area burned each year from 1984 to 2014, the
proportion of burned land suffering severe damage has ranged
from 5 to 21 percent (see Figure 3).
Land area burned by wildfires varies by state. Fires burn
more land in the western United States than in the East, and
parts of the West and Southwest show the largest increase in
burned acreage between the first half of the record
(1984–1999) and the second half (2000–2014) (see Figures 4
and 5). |
|
Background
Together, forests, shrubland, and grassland cover more than
half of the land area in the United States. These ecosystems
are important resources, both environmentally and
economically. Although wildfires occur naturally and play a
long-term role in the health of these ecosystems, climate
change threatens to increase the frequency, extent, and
severity of fires through increased temperatures and drought
(see the U.S. and Global Temperature and Drought
indicators). Earlier spring melting and reduced snowpack
(see the Snowpack indicator) result in decreased water
availability during hot summer conditions, which in turn
contributes to an increased wildfire risk, allowing fires to
start more easily and burn hotter. An increase in the length
of the fire season has been observed in some areas. In
addition to climate change, other factors—like the spread of
insects, land use, fuel availability, and management
practices, including fire suppression—play an important role
in wildfire frequency and intensity. All of these factors
influencing wildfires vary greatly by region and over time,
as do variations in precipitation, wind, temperature,
vegetation types, and landscape conditions. Therefore,
understanding changes in fire characteristics requires
long-term records, a regional perspective, and consideration
of many factors.
Wildfires have the potential to harm property, livelihoods,
and human health, particularly as population centers expand
into wild land areas. The recreation and timber industries
depend on healthy forests, and wildfire smoke has been
directly linked to poor air quality and illness, even in
communities far downwind. Fire-related threats are
increasing, especially as more people live in and around
forests, grasslands, and other natural areas.6 The United
States spends more than $1 billion every year to fight
wildfires and spent more than $2 billion in 2015.7 These
efforts have resulted in the deaths of hundreds of
firefighters since 1910.
Beyond the human impact, wildfires also affect the Earth’s
climate. Forests in particular store large amounts of
carbon. When they burn, they release carbon dioxide into the
atmosphere, which in turn contributes to climate change. |
|
About the Indicator
This indicator defines wildfires as “unplanned, unwanted
wildland fire[s]” in forests, shrubland, and grassland,
where “the objective is to put the fire out.” This indicator
tracks three aspects of wildfires over time: the total
number of fires (frequency), the total land area burned
(extent), and the degree of damage that fires cause to the
landscape (severity). The total area and total number of
fires are tracked by the National Interagency Fire Center,
which compiles reports from local, state, and federal
agencies that are involved in fighting wildfires. The U.S.
Forest Service tracked similar data using a different
reporting system until 1997. Those data have been added to
this indicator for comparison. Wildfire severity is measured
by comparing the “greenness” of satellite images taken
before and after a fire to classify how severely the land
has been burned. Burn severity provides an indication of the
ecological damage and how long the effects of wildfires are
likely to last.
Although some nationwide fire data have been collected since
the early 1900s, this indicator starts in 1983 (Figures 1
and 2) and 1984 (Figures 3, 4, and 5), when nationwide data
collection became more complete and standardized.
Indicator Notes
Many environmental impacts associated with climate change
can affect wildfire frequency, extent, or severity,
including changes in temperature, precipitation, and
drought. Human activities and land management practices also
affect wildfire activity, and preferred practices in
wildfire management have evolved over time, from older
policies that favored complete wildfire prevention to more
recent policies of wildfire suppression and controlled
burns. While this indicator is limited to “wildland” fires,
it includes fires that encroach on—or perhaps started
in—developed areas. Increased development in previously wild
lands could also influence trends in wildfire frequency and
extent. The total number of fires may also vary due to
reporting irregularities, as fires that split or merge
together across jurisdictional lines may be counted
differently.
Along with the influence of ongoing climate change, wildfire
patterns can be influenced by natural climate cycles that
tend to shift every few decades. Thus, the approximately 30
years of data shown here may not be enough to draw
conclusions about long-term trends. While a longer record
would be ideal, data from before 1983 are not consistent
enough nationally to be included in this indicator.
Data Sources
The full set of wildfire frequency and burned acreage data
in Figures 1 and 2 comes from the National Interagency Fire
Center, which compiles wildfire reports sent from local,
state, and federal entities that are involved in fighting
fires. These data are available online at:
www.nifc.gov/fireInfo/fireInfo_statistics.html.
Additional data were provided by the U.S. Forest Service
based on a different set of records, referred to as Smokey
Bear Reports. Burn severity data and state-by-state acreage
totals in Figures 3, 4, and 5 come from a multi-agency
project called Monitoring Trends in Burn Severity, which
maintains a database of wildfire events across the United
States. These data are publicly available at:
www.mtbs.gov/data/search.html.
Technical Documentation
Download related technical information PDF |
|
 Figure
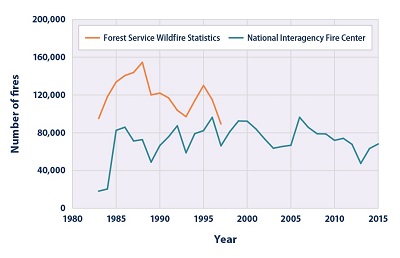
1. Wildfire Frequency in the United States, 1983–2015 Figure
1. Wildfire Frequency in the United States, 1983–2015
This figure shows the total number of wildfires per year
from 1983 to 2015. These totals include all reported
wildfires, which can be as small as just a few acres. The
two lines represent two different reporting systems; though
the Forest Service stopped collecting statistics (orange
line) in 1997 and will not update them, those statistics are
shown here for comparison.
Data source: NIFC, 2016;13 USDA Forest Service, 201414 |
 Figure
2. Wildfire Extent in the United States, 1983–2015 Figure
2. Wildfire Extent in the United States, 1983–2015
This figure shows annual wildfire-burned area (in millions
of acres) from 1983 to 2015. The two lines represent two
different reporting systems; though the Forest Service
stopped collecting statistics (orange line) in 1997 and is
not planning to update them, those statistics are shown here
for comparison.
Data source: NIFC, 2016;15 Short, 201516 |
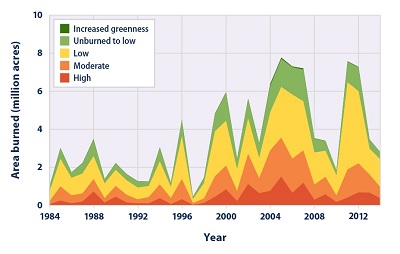 Figure
3. Damage Caused by Wildfires in the United States,
1984–2014 Figure
3. Damage Caused by Wildfires in the United States,
1984–2014
This figure shows the distribution of acreage burned by
large wildfires, based on the level of damage caused to the
landscape–a measure of wildfire severity. Large wildfires
are defined as fires with an area larger than 1,000 acres in
the western United States and 500 acres in the eastern
United States. The total acreage shown in Figure 3 is
slightly less than the total in Figure 2 because Figure 3 is
limited to large fires and because a few areas did not have
sufficient satellite imagery to allow damage to be assessed.
Data source: MTBS, 201617 |
|
|
|
EPA Page |
|
This is the
EPA page for this topic. To see if the Trump
administration has changed the EPA page, simply click the
link and compare the information with this page. If you
notice changes were made to the EPA page, please post a
comment. Thanks. |
|
|
Interactive Map
This map shows the average number of acres burned in each
state per year as a proportion of that state’s total land
area. Darker-shaded states have the largest proportion of
acreage burned. Click each state to reveal the data. For
reference, there are 640 acres in a square mile; therefore,
an average burned area of 6.4 acres per square mile would
mean that fires burned 1 percent of a state’s total land
area. A few states did not have any fires that were large
enough to be included in this analysis.
Data source: MTBS, 201618
Interactive Map
This map shows how the number of acres burned in each state
as a proportion of that state’s total land area has changed
over time, based on a simple comparison between the first
half of the available years (1984–1999) and the second half
(2000–2014). Click each state to reveal the data. For
reference, there are 640 acres in a square mile; therefore,
a change of 6.4 acres per square mile would mean that burned
area increased by 1 percent of a state’s total land area. A
few states did not have any fires that were large enough to
be included in this analysis.
Data source: MTBS, 201619 |
|
|
|
|
|
|
|
|
|
|
|
|
Additional Climate Change Information |
Climate Change and Carbon Dioxide
(Beginner - Listening,
reading)
A video lesson to
help with your understanding of climate change
and carbon dioxide.
The English is
spoken at 75% of normal speed.
Great English listening and reading practice. |
Carbon Dioxide and Climate Change
(Beginner - Listening,
reading)
A video lesson to
help with your understanding of carbon dioxide
and climate change.
The English is
spoken at 75% of normal speed.
Great English listening and reading practice. |
Environmental Group Warns Earth's Health at Risk
(Beginner - Listening,
reading)
A video lesson to
help with your understanding of climate change.
The English is
spoken at 75% of normal speed.
Great English listening and reading practice.
A report by the World Wildlife Fund looked at thousands of animal populations
and found they have dropped significantly in 40 years. |
Sea Levels Rising at Fastest Rate in 3,000 years
(Beginner - Listening,
reading)
A video lesson to
help with your understanding of climate change.
The English is
spoken at 75% of normal speed.
Great English listening and reading practice.
A group of scientists say sea levels are rising at record rates. Another group
found that January temperatures in the Arctic reached a record high. |
Capturing CO2 Gas Is Not Easy
(Beginner - Listening,
reading)
A video lesson to
help with your understanding of climate change.
The English is
spoken at 75% of normal speed.
Great English listening and reading practice.
Most scientists agree that carbon-dioxide gas is partly to blame for climate
change: rising global temperatures. But capturing the CO2 gas released by power
stations is costly and difficult. |
Growth, Climate Change Threaten African Plants and
Animals
(Beginner - Listening,
reading)
A video lesson to
help with your understanding of climate change.
The English is
spoken at 75% of normal speed.
Great English listening and reading practice.
Researchers believe Africa may lose as much as 30 percent of its animal and
plant species by the end of this century. |
|
|
|
|
Search Fun Easy English |
|
|
|
|
|
|
|
|
|
|
|
|
|
|
|
About
Contact
Copyright
Resources
Site Map |