|
|
| |
|
|
| |
|
|
|
|
| |
 Climate Change Indicators: Drought Climate Change Indicators: Drought
This indicator measures drought conditions of U.S. lands.
Key Points
Average drought conditions across the nation have varied
since records began in 1895. The 1930s and 1950s saw the
most widespread droughts, while the last 50 years have
generally been wetter than average (see Figure 1).
Over the period from 2000 through 2015, roughly 20 to 70
percent of the U.S. land area experienced conditions that
were at least abnormally dry at any given time (see Figure
2). The years 2002–2003 and 2012–2013 had a relatively large
area with at least abnormally dry conditions, while 2001,
2005, and 2009–2011 had substantially less area experiencing
drought.
During the latter half of 2012, more than half of the U.S.
land area was covered by moderate or greater drought (see
Figure 2). In several states, 2012 was among the driest
years on record. See Temperature and Drought in the
Southwest for a closer look at recent drought conditions in
one of the hardest-hit regions. |
|
Background
There are many definitions and types of drought.
Meteorologists generally define drought as a prolonged
period of dry weather caused by a lack of precipitation that
results in a serious water shortage for some activity,
population, or ecological system. Drought can also be
thought of as an extended imbalance between precipitation
and evaporation.
As average temperatures have risen because of climate
change, the Earth’s water cycle has sped up through an
increase in the rate of evaporation. An increase in
evaporation makes more water available in the air for
precipitation, but contributes to drying over some land
areas, leaving less moisture in the soil. Thus, as the
climate continues to change, many areas are likely to
experience increased precipitation (see the U.S. and Global
Precipitation indicator) and increased risk of flooding (see
the Heavy Precipitation indicator), while areas located far
from storm tracks are likely to experience less
precipitation and increased risk of drought. As a result,
since the 1950s, some regions of the world have experienced
longer and more intense droughts, particularly in southern
Europe and West Africa, while other regions have seen
droughts become less frequent, less intense, or shorter (for
example, in central North America).
Drought conditions can negatively affect agriculture, water
supplies, energy production, and many other aspects of
society. The impacts vary depending on the type, location,
intensity, and duration of the drought. For example, effects
on agriculture can range from slowed plant growth to severe
crop losses, while water supply impacts can range from
lowered reservoir levels and dried-up streams to major water
shortages. Prolonged droughts pose a particular threat to
indigenous populations because of their economic and
cultural dependence on land and water supplies. Warming and
drought can threaten medicinal and culturally important
plants and animals and can reduce water quality and
availability, making tribal populations particularly
vulnerable to waterborne illnesses. Lower streamflow and
groundwater levels can also harm plants and animals, and
dried-out vegetation increases the risk of wildfires. |
|
About the Indicator
During the 20th century, many indices were created to
measure drought severity by looking at precipitation, soil
moisture, stream flow, vegetation health, and other
variables. Figure 1 shows annual values of the most widely
used index, the Palmer Drought Severity Index, which is
calculated from precipitation and temperature measurements
at weather stations. An index value of zero represents the
average moisture conditions observed between 1931 and 1990
at a given location. A positive value means conditions are
wetter than average, while a negative value is drier than
average. Index values from locations across the contiguous
48 states have been averaged together to produce the
national values shown in Figure 1.
For a more detailed perspective on recent trends, Figure 2
shows a newer index called the Drought Monitor, which is
based on several indices (including Palmer), along with
additional factors such as snow water content, groundwater
levels, reservoir storage, pasture/range conditions, and
other impacts. The Drought Monitor uses codes from D0 to D4
(see table below Figure 2) to classify drought severity.
This part of the indicator covers all 50 states and Puerto
Rico.
Indicator Notes
Because this indicator focuses on national trends, it does
not show how drought conditions vary by region. For example,
even if half of the country suffered from severe drought,
Figure 1 could show an average index value close to zero if
the rest of the country was wetter than average. Thus,
Figure 1 might understate the degree to which droughts are
becoming more severe in some areas while other places
receive more rain as a result of climate change.
The U.S. Drought Monitor (Figure 2) offers a closer look at
the percentage of the country that is affected by drought.
This index is relatively new, however, and thus too
short-lived to be used for assessing long-term climate
trends or exploring how recent observations compare with
historical patterns. With several decades of data
collection, future versions of this indicator should be able
to paint a more complete picture of trends over time.
Overall, this indicator gives a broad overview of drought
conditions in the United States. It is not intended to
replace local or state information that might describe
conditions more precisely for a particular region.
Data Sources
Data for Figure 1 were obtained from the National Oceanic
and Atmospheric Administration’s National Centers for
Environmental Information, which maintains a large
collection of climate data online at:
https://www7.ncdc.noaa.gov/CDO/CDODivisionalSelect.jsp.
Data for Figure 2 were provided by the National Drought
Mitigation Center. Historical data in table form are
available at:
https://droughtmonitor.unl.edu/MapsAndData.aspx.
Technical Documentation
Download related technical information PDF |
|
 Figure
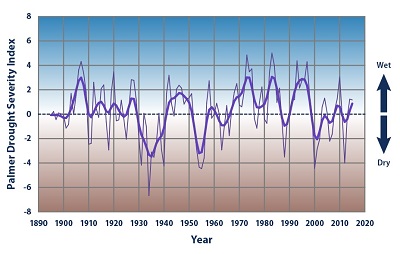
1. Average Drought Conditions in the Contiguous 48
States, 1895–2015 Figure
1. Average Drought Conditions in the Contiguous 48
States, 1895–2015
This chart shows annual values of the Palmer Drought
Severity Index, averaged over the entire area of the
contiguous 48 states. Positive values represent
wetter-than-average conditions, while negative values
represent drier-than-average conditions. A value between -2
and -3 indicates moderate drought, -3 to -4 is severe
drought, and -4 or below indicates extreme drought. The
thicker line is a nine-year weighted average.
Data source: NOAA, 20165 |
 Figure
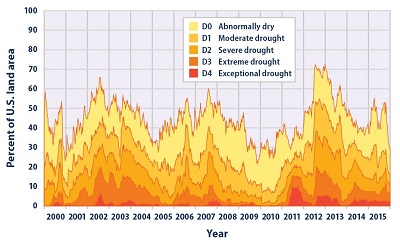
2. U.S. Lands Under Drought Conditions, 2000–2015 Figure
2. U.S. Lands Under Drought Conditions, 2000–2015
This chart shows the percentage of U.S. lands classified
under drought conditions from 2000 through 2015. This figure
uses the U.S. Drought Monitor classification system, which
is described in the table below. The data cover all 50
states plus Puerto Rico.
Data source: National Drought Mitigation Center, 20166 |
|
Categories of Drought Severity |
|
Category |
Description |
Possible Impacts |
| D0 |
Abnormally dry |
Going into drought: short-term dryness slowing planting or growth of crops or
pastures. Coming out of drought: some lingering water deficits; pastures or
crops not fully recovered. |
| D1 |
Moderate drought |
Some damage to crops or pastures; streams, reservoirs, or wells low; some
water shortages developing or imminent; voluntary water use restrictions
requested. |
| D2 |
Severe drought |
Crop or pasture losses likely; water shortages common; water restrictions
imposed. |
| D3 |
Extreme drought |
Major crop/pasture losses; widespread water shortages or restrictions. |
| D4 |
Exceptional drought |
Exceptional and widespread crop/pasture losses; shortages of water in
reservoirs, streams, and wells, creating water emergencies. |
|
|
Experts update the U.S. Drought Monitor weekly and produce
maps that illustrate current conditions as well as short-
and long-term trends. Major participants include the
National Oceanic and Atmospheric Administration, the U.S.
Department of Agriculture, and the National Drought
Mitigation Center. For a map of current drought conditions,
visit the Drought Monitor website at:
https://droughtmonitor.unl.edu. |
|
|
|
EPA Page |
|
This is the
EPA page for this topic. To see if the Trump
administration has changed the EPA page, simply click the
link and compare the information with this page. If you
notice changes were made to the EPA page, please post a
comment. Thanks. |
|
|
|
|
|
|
|
|
|
|
|
|
Additional Climate Change Information |
Climate Change and Carbon Dioxide
(Beginner - Listening,
reading)
A video lesson to
help with your understanding of climate change
and carbon dioxide.
The English is
spoken at 75% of normal speed.
Great English listening and reading practice. |
Carbon Dioxide and Climate Change
(Beginner - Listening,
reading)
A video lesson to
help with your understanding of carbon dioxide
and climate change.
The English is
spoken at 75% of normal speed.
Great English listening and reading practice. |
Environmental Group Warns Earth's Health at Risk
(Beginner - Listening,
reading)
A video lesson to
help with your understanding of climate change.
The English is
spoken at 75% of normal speed.
Great English listening and reading practice.
A report by the World Wildlife Fund looked at thousands of animal populations
and found they have dropped significantly in 40 years. |
Sea Levels Rising at Fastest Rate in 3,000 years
(Beginner - Listening,
reading)
A video lesson to
help with your understanding of climate change.
The English is
spoken at 75% of normal speed.
Great English listening and reading practice.
A group of scientists say sea levels are rising at record rates. Another group
found that January temperatures in the Arctic reached a record high. |
Capturing CO2 Gas Is Not Easy
(Beginner - Listening,
reading)
A video lesson to
help with your understanding of climate change.
The English is
spoken at 75% of normal speed.
Great English listening and reading practice.
Most scientists agree that carbon-dioxide gas is partly to blame for climate
change: rising global temperatures. But capturing the CO2 gas released by power
stations is costly and difficult. |
Growth, Climate Change Threaten African Plants and
Animals
(Beginner - Listening,
reading)
A video lesson to
help with your understanding of climate change.
The English is
spoken at 75% of normal speed.
Great English listening and reading practice.
Researchers believe Africa may lose as much as 30 percent of its animal and
plant species by the end of this century. |
|
|
|
|
Search Fun Easy English |
|
|
|
|
|
|
|
|
|
|
|
|
|
|
|
About
Contact
Copyright
Resources
Site Map |