|
|
| |
|
|
| |
|
|
|
|
| |
 Climate
Change Indicators: Ocean Heat Climate
Change Indicators: Ocean Heat
This indicator describes trends in the amount of heat stored
in the world’s oceans.
Key Points
In three different data analyses, the long-term trend shows
that the oceans have become warmer since 1955 (see Figure
1).
Although concentrations of greenhouse gases have risen at a
relatively steady rate over the past few decades (see the
Atmospheric Concentrations of Greenhouse Gases indicator),
the rate of change in ocean heat content can vary from year
to year (see Figure 1). Year-to-year changes are influenced
by events such as volcanic eruptions and recurring
ocean-atmosphere patterns such as El Niño. |
|
Background
When sunlight reaches the Earth’s surface, the world’s
oceans absorb some of this energy and store it as heat. This
heat is initially absorbed at the surface, but some of it
eventually spreads to deeper waters. Currents also move this
heat around the world. Water has a much higher heat capacity
than air, meaning the oceans can absorb larger amounts of
heat energy with only a slight increase in temperature.
The total amount of heat stored by the oceans is called
“ocean heat content,” and measurements of water temperature
reflect the amount of heat in the water at a particular time
and location. Ocean temperature plays an important role in
the Earth’s climate system—particularly sea surface
temperature (see the Sea Surface Temperature
indicator)—because heat from ocean surface waters provides
energy for storms and thereby influences weather patterns.
Increasing greenhouse gas concentrations are trapping more
energy from the sun. Because changes in ocean systems occur
over centuries, the oceans have not yet warmed as much as
the atmosphere, even though they have absorbed more than 90
percent of the Earth’s extra heat since 1955. If not for the
large heat-storage capacity provided by the oceans, the
atmosphere would warm more rapidly. Increased heat
absorption also changes ocean currents because many currents
are driven by differences in temperature, which cause
differences in density. These currents influence climate
patterns and sustain ecosystems that depend on certain
temperature ranges.
Because water expands slightly as it gets warmer, an
increase in ocean heat content will also increase the volume
of water in the ocean, which is one cause of the observed
increases in sea level (see the Sea Level indicator). |
|
About the Indicator
This indicator shows trends in global ocean heat content
from 1955 to 2015. These data are available for the top 700
meters of the ocean (nearly 2,300 feet), which accounts for
just under 20 percent of the total volume of water in the
world’s oceans. The indicator measures ocean heat content in
joules, which are units of energy.
The National Oceanic and Atmospheric Administration has
calculated changes in ocean heat content based on
measurements of ocean temperatures around the world at
different depths. These measurements come from a variety of
instruments deployed from ships and airplanes and, more
recently, underwater robots. Thus, the data must be
carefully adjusted to account for differences among
measurement techniques and data collection programs. Figure
1 shows three independent interpretations of essentially the
same underlying data.
Indicator Notes
Data must be carefully reconstructed and filtered for biases
because of different data collection techniques and uneven
sampling over time and space. Various methods of correcting
the data have led to slightly different versions of the
ocean heat trend line. Scientists continue to compare their
results and improve their estimates over time. They also
test their ocean heat estimates by looking at corresponding
changes in other properties of the ocean. For example, they
can check to see whether observed changes in sea level match
the amount of sea level rise that would be expected based on
the estimated change in ocean heat.
Data Sources
Data for this indicator were collected by the National
Oceanic and Atmospheric Administration and other
organizations around the world. The data were analyzed
independently by researchers at the National Oceanic and
Atmospheric Administration, Australia’s Commonwealth
Scientific and Industrial Research Organisation, and the
Japan Meteorological Agency’s Meteorological Research
Institute.
Technical Documentation
Download related technical information PDF |
|
 Figure
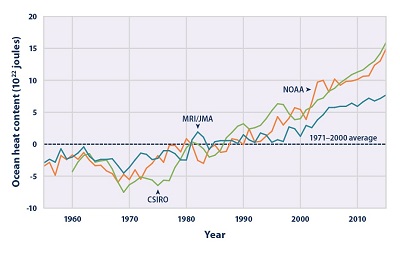
1. Ocean Heat Content, 1955–2015 Figure
1. Ocean Heat Content, 1955–2015
This figure shows changes in ocean heat content between 1955
and 2015. Ocean heat content is measured in joules, a unit
of energy, and compared against the 1971–2000 average, which
is set at zero for reference. Choosing a different baseline
period would not change the shape of the data over time. The
lines were independently calculated using different methods
by government agencies in three countries: the National
Oceanic and Atmospheric Administration (NOAA), Australia’s
Commonwealth Scientific and Industrial Research Organisation
(CSIRO), and Japan Meteorological Agency’s Meteorological
Research Institute (MRI/JMA). For reference, an increase of
1 unit on this graph (1 x 10²² joules) is equal to
approximately 18 times the total amount of energy used by
all the people on Earth in a year.
Data sources: CSIRO, 20165; MRI/JMA, 20166; NOAA, 20167 |
|
|
|
EPA Page |
|
This is the
EPA page for this topic. To see if the Trump
administration has changed the EPA page, simply click the
link and compare the information with this page. If you
notice changes were made to the EPA page, please post a
comment. Thanks. |
|
|
|
|
|
|
|
|
|
|
|
|
Additional Climate Change Information |
Climate Change and Carbon Dioxide
(Beginner - Listening,
reading)
A video lesson to
help with your understanding of climate change
and carbon dioxide.
The English is
spoken at 75% of normal speed.
Great English listening and reading practice. |
Carbon Dioxide and Climate Change
(Beginner - Listening,
reading)
A video lesson to
help with your understanding of carbon dioxide
and climate change.
The English is
spoken at 75% of normal speed.
Great English listening and reading practice. |
Environmental Group Warns Earth's Health at Risk
(Beginner - Listening,
reading)
A video lesson to
help with your understanding of climate change.
The English is
spoken at 75% of normal speed.
Great English listening and reading practice.
A report by the World Wildlife Fund looked at thousands of animal populations
and found they have dropped significantly in 40 years. |
Sea Levels Rising at Fastest Rate in 3,000 years
(Beginner - Listening,
reading)
A video lesson to
help with your understanding of climate change.
The English is
spoken at 75% of normal speed.
Great English listening and reading practice.
A group of scientists say sea levels are rising at record rates. Another group
found that January temperatures in the Arctic reached a record high. |
Capturing CO2 Gas Is Not Easy
(Beginner - Listening,
reading)
A video lesson to
help with your understanding of climate change.
The English is
spoken at 75% of normal speed.
Great English listening and reading practice.
Most scientists agree that carbon-dioxide gas is partly to blame for climate
change: rising global temperatures. But capturing the CO2 gas released by power
stations is costly and difficult. |
Growth, Climate Change Threaten African Plants and
Animals
(Beginner - Listening,
reading)
A video lesson to
help with your understanding of climate change.
The English is
spoken at 75% of normal speed.
Great English listening and reading practice.
Researchers believe Africa may lose as much as 30 percent of its animal and
plant species by the end of this century. |
|
|
|
|
Search Fun Easy English |
|
|
|
|
|
|
|
|
|
|
|
|
|
|
|
About
Contact
Copyright
Resources
Site Map |