|
|
| |
|
|
| |
|
|
|
|
| |
 Climate Change Indicators:
Streamflow Climate Change Indicators:
Streamflow
This indicator describes trends in the amount of water
carried by streams across the United States, as well as the
timing of runoff associated with snowmelt.
Key Points
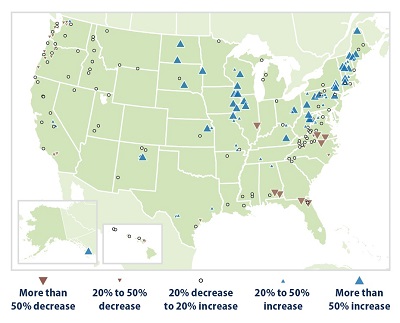
During the past 75 years, seven-day low flows have generally
increased in the Northeast and Midwest (in other words, on
the days of lowest flows, streams in these areas are
carrying more water than before). Low flows have generally
decreased in parts of the Southeast and the Pacific
Northwest (that is, streams are carrying less water than
before). Overall, more sites have experienced increases than
decreases (see Figure 1).
Three-day high-flow trends vary from region to region across
the country. For example, high flows have generally
increased or changed little in the Northeast since 1940,
whereas high flows have increased in some West Coast streams
and decreased in others. Overall, more sites have
experienced increases than decreases (see Figure 2).
Annual average streamflow has increased at many sites in the
Northeast and Midwest, while other regions have seen few
substantial changes. Overall, sites show more increases than
decreases (see Figure 3).
In parts of the country with substantial snowmelt,
winter-spring runoff is happening at least five days earlier
than in the mid-20th century at most gauges. The largest
changes have occurred in the Pacific Northwest and Northeast
(see Figure 4). |
|
Background
Streamflow is a measure of the rate at which water is
carried by rivers and streams, and it represents a critical
resource for people and the environment. Changes in
streamflow can directly influence the supply of drinking
water and the amount of water available for irrigating
crops, generating electricity, and other needs. In addition,
many plants and animals depend on streamflow for habitat and
survival.
Streamflow naturally varies over the course of a year. For
example, rivers and streams in many parts of the country
have their highest flow when snow melts in the spring and
their lowest flow in late summer. The amount of streamflow
is important because very high flows can cause erosion and
damaging floods, while very low flows can diminish water
quality, harm fish, and reduce the amount of water available
for people to use. The timing of high flow is important
because it affects the ability of reservoir managers to
store water to meet needs later in the year. In addition,
some plants and animals (such as fish that migrate) depend
on a particular pattern of streamflow as part of their life
cycles.
Climate change can affect streamflow in several ways.
Changes in the amount of spring snowpack (see the Snowpack
indicator) and air temperatures that influence melting can
alter the size and timing of high spring streamflows. More
precipitation is expected to cause higher average streamflow
in some places, while heavier storms (see the Heavy
Precipitation indicator) could lead to larger peak flows.
More frequent or severe droughts, however, could reduce
streamflow in certain areas. |
|
About the Indicator
The U.S. Geological Survey measures streamflow in rivers and
streams across the United States using continuous monitoring
devices called stream gauges. This indicator is based on
data from 192 stream gauges located in areas where trends
are not substantially influenced by dams, reservoir
management, wastewater treatment facilities, or land-use
change. The indicator also excludes stream gauges with
watershed areas that overlap substantially.
This indicator examines four important measures of
streamflow conditions that occur during the course of a
year. Figure 1 shows trends in the lowest flows each year,
which are commonly calculated by averaging the lowest seven
consecutive days of streamflow. Figure 2 shows trends in
high flow conditions, which are commonly calculated by
averaging the highest three consecutive days of streamflow
in a year. Three days is an optimal length of time to
characterize runoff associated with large storms and peak
snowmelt. Figure 3 shows changes in the annual average
streamflow, which is calculated by averaging daily flows
through the entire year.
Figure 4 shows trends in the timing of winter and spring
runoff. This measure is limited to 56 stream gauges in areas
where at least 30 percent of annual precipitation falls as
snow. Scientists look at the total volume of water that
passes by a gauge between January 1 and July 31 for the
western United States, and January 1 and May 31 for the
eastern United States, then determine the date when exactly
half of that water has gone by. This date is called the
winter-spring center-of-volume date. A long-term trend
toward an earlier date could be caused by earlier spring
snowmelt, more precipitation falling as rain instead of
snow, or other changes in precipitation patterns.
Indicator Notes
Streamflow measurements were used from gauges in areas where
streamflow is minimally affected by human influences such as
dams, land development, or changes in land cover. Changes in
land cover and land use over time, however, could still
influence streamflow trends at some streams. The gauges used
for this indicator are not evenly distributed across the
country, due to variation in the availability of long-term
data.
Data Sources
Streamflow data were collected by the U.S. Geological
Survey. These data came from a set of gauges in watersheds
with minimal human impacts, which have been classified as
reference gauges. Daily average streamflow data are stored
in the National Water Information System and are publicly
available at:
https://waterdata.usgs.gov/nwis.
Technical Documentation
Download related technical information PDF |
|
 Figure
1. Seven-Day Low Streamflows in the United States,
1940–2014 Figure
1. Seven-Day Low Streamflows in the United States,
1940–2014
This map shows percentage changes in the minimum annual
streamflow for rivers and streams across the country, based
on the long-term rate of change from 1940 to 2014. Minimum
streamflow is based on the consecutive seven-day period with
the lowest average flow during a given year.
Data source: USGS, 20161 |
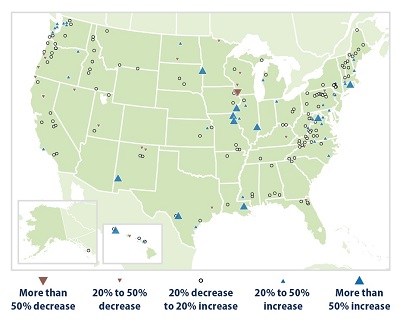 Figure
2. Three-Day High Streamflows in the United States,
1940–2014 Figure
2. Three-Day High Streamflows in the United States,
1940–2014
This map shows percentage changes in the maximum annual
streamflow for rivers and streams across the country, based
on the long-term rate of change from 1940 to 2014. Maximum
streamflow is based on the consecutive three-day period with
the highest average flow during a given year.
Data source: USGS, 20162 |
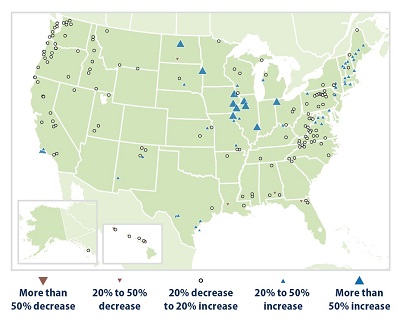 Figure
3. Annual Average Streamflow in the United States,
1940–2014 Figure
3. Annual Average Streamflow in the United States,
1940–2014
This map shows percentage changes in the annual average
streamflow for rivers and streams across the country, based
on the long-term rate of change from 1940 to 2014. This map
is based on daily streamflow measurements, averaged over the
entire year.
Data source: USGS, 20163 |
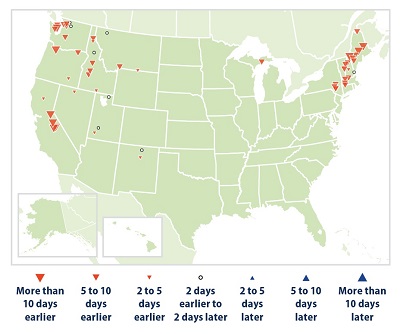 Figure
4. Timing of Winter-Spring Runoff in the United
States, 1940–2014 Figure
4. Timing of Winter-Spring Runoff in the United
States, 1940–2014
This map shows changes in the timing of annual high
winter-spring flow carried by rivers and streams from 1940
to 2014. This analysis focuses on parts of the country where
streamflow is strongly influenced by snowmelt. Trends are
based on the winter-spring center of volume, which is the
date when half of the total January 1–July 31 streamflow (in
the West) or half of the total January 1–May 31 streamflow
(in the East) has passed by each streamflow gauge,
reflecting the timing of spring snowmelt.
Data source: USGS, 20164 |
|
|
|
EPA Page |
|
This is the
EPA page for this topic. To see if the Trump
administration has changed the EPA page, simply click the
link and compare the information with this page. If you
notice changes were made to the EPA page, please post a
comment. Thanks. |
|
|
|
|
|
|
|
|
|
|
|
|
Additional Climate Change Information |
Climate Change and Carbon Dioxide
(Beginner - Listening,
reading)
A video lesson to
help with your understanding of climate change
and carbon dioxide.
The English is
spoken at 75% of normal speed.
Great English listening and reading practice. |
Carbon Dioxide and Climate Change
(Beginner - Listening,
reading)
A video lesson to
help with your understanding of carbon dioxide
and climate change.
The English is
spoken at 75% of normal speed.
Great English listening and reading practice. |
Environmental Group Warns Earth's Health at Risk
(Beginner - Listening,
reading)
A video lesson to
help with your understanding of climate change.
The English is
spoken at 75% of normal speed.
Great English listening and reading practice.
A report by the World Wildlife Fund looked at thousands of animal populations
and found they have dropped significantly in 40 years. |
Sea Levels Rising at Fastest Rate in 3,000 years
(Beginner - Listening,
reading)
A video lesson to
help with your understanding of climate change.
The English is
spoken at 75% of normal speed.
Great English listening and reading practice.
A group of scientists say sea levels are rising at record rates. Another group
found that January temperatures in the Arctic reached a record high. |
Capturing CO2 Gas Is Not Easy
(Beginner - Listening,
reading)
A video lesson to
help with your understanding of climate change.
The English is
spoken at 75% of normal speed.
Great English listening and reading practice.
Most scientists agree that carbon-dioxide gas is partly to blame for climate
change: rising global temperatures. But capturing the CO2 gas released by power
stations is costly and difficult. |
Growth, Climate Change Threaten African Plants and
Animals
(Beginner - Listening,
reading)
A video lesson to
help with your understanding of climate change.
The English is
spoken at 75% of normal speed.
Great English listening and reading practice.
Researchers believe Africa may lose as much as 30 percent of its animal and
plant species by the end of this century. |
|
|
|
|
Search Fun Easy English |
|
|
|
|
|
|
|
|
|
|
|
|
|
|
|
About
Contact
Copyright
Resources
Site Map |