|
|
| |
|
|
| |
|
|
| Temperature and Drought in the Southwest |
|
| |
 A Closer Look: Temperature and
Drought in the Southwest A Closer Look: Temperature and
Drought in the Southwest
This feature provides a closer look at trends in temperature
and drought in the southwestern United States.
Key Points
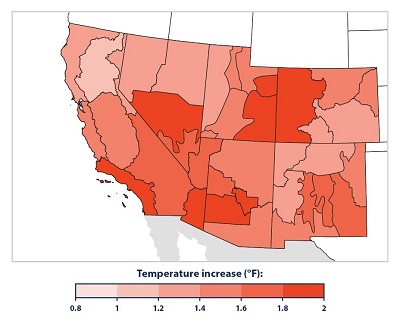
Every part of the Southwest experienced higher average
temperatures between 2000 and 2015 than the long-term
average (1895–2015). Some areas were nearly 2°F warmer than
average (see Figure 1).
Large portions of the Southwest have experienced drought
conditions since weekly Drought Monitor records began in
2000. For extended periods from 2002 to 2005 and from 2012
through 2015, nearly the entire region was abnormally dry or
even drier (see Figure 2).
Based on the long-term Palmer Index, drought conditions in
the Southwest have varied since 1895. The early 1900s and
the 1950s experienced considerable drought, the 1980s were
relatively wet, and the last decade has seen the most
persistent droughts on record (see Figure 3).
Background was not available for this page. |
|
Notes
Natural variability, changes in irrigation practices, and
other diversions of water for human use can influence
certain drought-related measurements. Soil moisture, ground
water, and streamflow are part of Drought Monitor
calculations (Figure 2), and they are all sensitive to human
activities. |
|
Data Sources
Data for Figures 1 and 3 were obtained from the National
Oceanic and Atmospheric Administration’s National Centers
for Environmental Information, which maintains a large
collection of climate data online at: www.ncei.noaa.gov.
Data for Figure 2 were provided by the National Drought
Mitigation Center, which gives historical data in table form
at:
https://droughtmonitor.unl.edu/MapsAndData.aspx.
Technical Documentation
Download related technical information PDF |
|
 Figure
1. Average Temperatures in the Southwestern United
States, 2000–2015 Versus Long-Term Average Figure
1. Average Temperatures in the Southwestern United
States, 2000–2015 Versus Long-Term Average
This map shows how the average air temperature from 2000 to
2015 has differed from the long-term average (1895–2015). To
provide more detailed information, each state has been
divided into climate divisions, which are zones that share
similar climate features.
Data source: NOAA, 20162 |
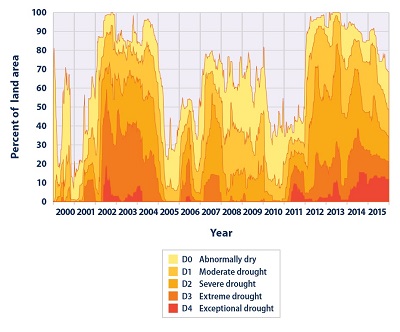 Figure
2. Southwestern U.S. Lands Under Drought Conditions,
2000–2015 Figure
2. Southwestern U.S. Lands Under Drought Conditions,
2000–2015
This chart shows the percentage of land area in six
southwestern states (Arizona, California, Colorado, Nevada,
New Mexico, and Utah) classified under drought conditions
from 2000 through 2015. This figure uses the U.S. Drought
Monitor classification system, which is described in the
table in the Drought indicator.
Data source: National Drought Mitigation Center, 20163 |
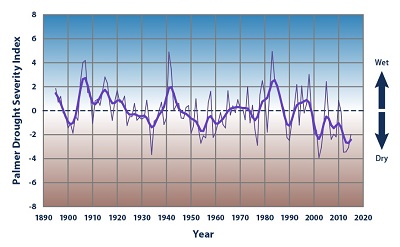 Figure
3. Drought Severity in the Southwestern United
States, 1895–2015 Figure
3. Drought Severity in the Southwestern United
States, 1895–2015
This chart shows annual values of the Palmer Drought
Severity Index, averaged over six states in the Southwest
(Arizona, California, Colorado, Nevada, New Mexico, and
Utah). Positive values represent wetter-than-average
conditions, while negative values represent
drier-than-average conditions. A value between -2 and -3
indicates moderate drought, -3 to -4 is severe drought, and
-4 or below indicates extreme drought. The thicker line is a
nine-year weighted average.
Data source: NOAA, 20164 |
|
|
|
EPA Page |
|
This is the
EPA page for this topic. To see if the Trump
administration has changed the EPA page, simply click the
link and compare the information with this page. If you
notice changes were made to the EPA page, please post a
comment. Thanks. |
|
|
|
|
|
|
|
|
|
|
|
|
Additional Climate Change Information |
Climate Change and Carbon Dioxide
(Beginner - Listening,
reading)
A video lesson to
help with your understanding of climate change
and carbon dioxide.
The English is
spoken at 75% of normal speed.
Great English listening and reading practice. |
Carbon Dioxide and Climate Change
(Beginner - Listening,
reading)
A video lesson to
help with your understanding of carbon dioxide
and climate change.
The English is
spoken at 75% of normal speed.
Great English listening and reading practice. |
Environmental Group Warns Earth's Health at Risk
(Beginner - Listening,
reading)
A video lesson to
help with your understanding of climate change.
The English is
spoken at 75% of normal speed.
Great English listening and reading practice.
A report by the World Wildlife Fund looked at thousands of animal populations
and found they have dropped significantly in 40 years. |
Sea Levels Rising at Fastest Rate in 3,000 years
(Beginner - Listening,
reading)
A video lesson to
help with your understanding of climate change.
The English is
spoken at 75% of normal speed.
Great English listening and reading practice.
A group of scientists say sea levels are rising at record rates. Another group
found that January temperatures in the Arctic reached a record high. |
Capturing CO2 Gas Is Not Easy
(Beginner - Listening,
reading)
A video lesson to
help with your understanding of climate change.
The English is
spoken at 75% of normal speed.
Great English listening and reading practice.
Most scientists agree that carbon-dioxide gas is partly to blame for climate
change: rising global temperatures. But capturing the CO2 gas released by power
stations is costly and difficult. |
Growth, Climate Change Threaten African Plants and
Animals
(Beginner - Listening,
reading)
A video lesson to
help with your understanding of climate change.
The English is
spoken at 75% of normal speed.
Great English listening and reading practice.
Researchers believe Africa may lose as much as 30 percent of its animal and
plant species by the end of this century. |
|
|
|
|
Search Fun Easy English |
|
|
|
|
|
|
|
|
|
|
|
|
|
|
|
About
Contact
Copyright
Resources
Site Map |